Getting started with GoFigr
Account registration
Before you begin, create an account at https://app.gofigr.io/register
Client setup
First, install the gofigr client library:
$ pip install gofigr
Once installed, configure it with gfconfig. The tool will prompt you for a
username and password, and a default workspace.
$ gfconfig
------------------------------
GoFigr configuration
------------------------------
Username: mpacula
Password:
Verifying connection...
  => Connected successfully

Please select a default workspace:
  [ 1] - Primary Workspace              - mpacula's primary workspace    - API ID: c6ecd353-321d-4089-b5aa-d94bf0ecb09a
Selection [1]: 1

Configuration saved to /Users/maciej/.gofigr. Happy analysis!
gfconfig only configures the defaults. You will be able to customize
any of the options on a per-notebook basis.
Advanced configuration
Optionally, you can call gfconfig --advanced and customize some additional options:
- API URL:
This is the API URL that the client will connect to. We use it for development, but you can just accept the default.
- Auto-publish:
Whether to automatically capture and publish all figures generated by Jupyter, even without an explicit call to
publish. Auto-publish is on by default, but you can disable it here.- Default revision metadata:
JSON that we will automatically store with each figure revision. This is completely up to you. You can leave it empty or include details relevant to your team or organization.
$ gfconfig --advanced
------------------------------
GoFigr configuration
------------------------------
Username: mpacula
Password:
API URL [https://api.gofigr.io]:
Verifying connection...
  => Connected successfully
Auto-publish all figures [Y/n]: y
Default revision metadata (JSON): {"study": "First in Human trial"}

Please select a default workspace:
  [ 1] - Primary Workspace              - mpacula's primary workspace    - API ID: c6ecd353-321d-4089-b5aa-d94bf0ecb09a
Selection [1]: 1

Configuration saved to /Users/maciej/.gofigr. Happy analysis!
Environment variables
By default, GoFigr reads configuration from the file .gofigr in the user’s home directory. However, you
can also use environment variables:
GF_USERNAME
GF_PASSWORD
GF_WORKSPACE: must be an API ID (look it up in the Web App)
GF_ANALYSIS: must be an API ID (look it up in the Web App)
GF_URL: API URL
GF_AUTO_PUBLISH: true or false
Jupyter setup
GoFigr works with both Jupyter Notebook and Jupyter Lab. To use it, simply
load the extension and call gofigr.jupyter.configure():
%load_ext gofigr

from gofigr.jupyter import *

configure(analysis=FindByName("My Analysis", create=True))
This will set your current analysis to My Analysis under the default workspace (selected through gfconfig),
creating it if it doesn’t already exist.
You can also specify a custom workspace, override auto_publish, or supply
default revision metadata:
%load_ext gofigr

from gofigr.jupyter import *

configure(auto_publish=False,
          workspace=FindByName("Primary Workspace", create=False),
          analysis=FindByName("My Analysis", create=True),
          default_metadata={'requested_by': "Alyssa",
                            'study': 'Pivotal Trial 1'})
Specifying names & IDs
Instead of using FindByName, you can avoid ambiguity and specify API IDs directly. You
can find the API IDs for workspaces and analyses in the web app. Mixing and matching
is supported as well:
%load_ext gofigr

from gofigr.jupyter import *

configure(workspace=ApiId("59da9bdb-2095-47a9-b414-c029f8a00e0e"),
          analysis=FindByName("My Analysis", create=True))
Publishing your first figure
To publish your first figure, simply call publish (if you have auto-publish turned on,
the figure will be published automatically without this call). For example, here we publish
a scatter plot:
from datetime import datetime
def test_figure(figsize=(7, 7)):
    df = pd.DataFrame(
         {"x1": npr.normal(size=100),
          "y1": npr.normal(size=100),

          "x2": npr.normal(size=100) + 2,
          "y2": npr.normal(size=100) + 3,

          "x3": npr.normal(size=100) + 3,
          "y3": npr.normal(size=100) - 2})

    fig = plt.figure(figsize=figsize)
    plt.scatter(x=df['x1'], y=df['y1'])
    plt.scatter(x=df['x2'], y=df['y2'])
    plt.scatter(x=df['x3'], y=df['y3'])

    plt.title(f"Example scatter\n{datetime.now()}")
    return plt.gcf(), df

_ = test_figure()

publish(fig=plt.gcf(), target=FindByName("My first figure!", create=True))
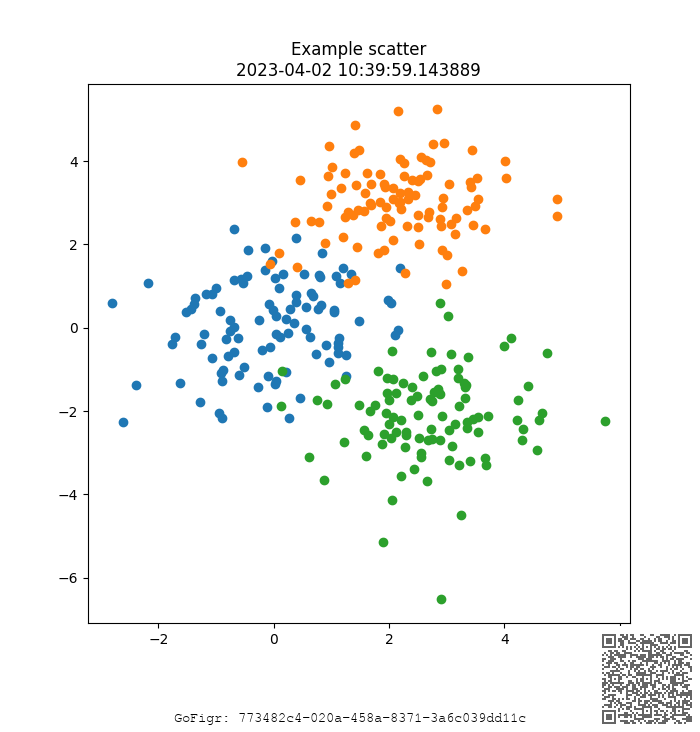
You will get a barcoded image with a QR code and a unique revision ID:

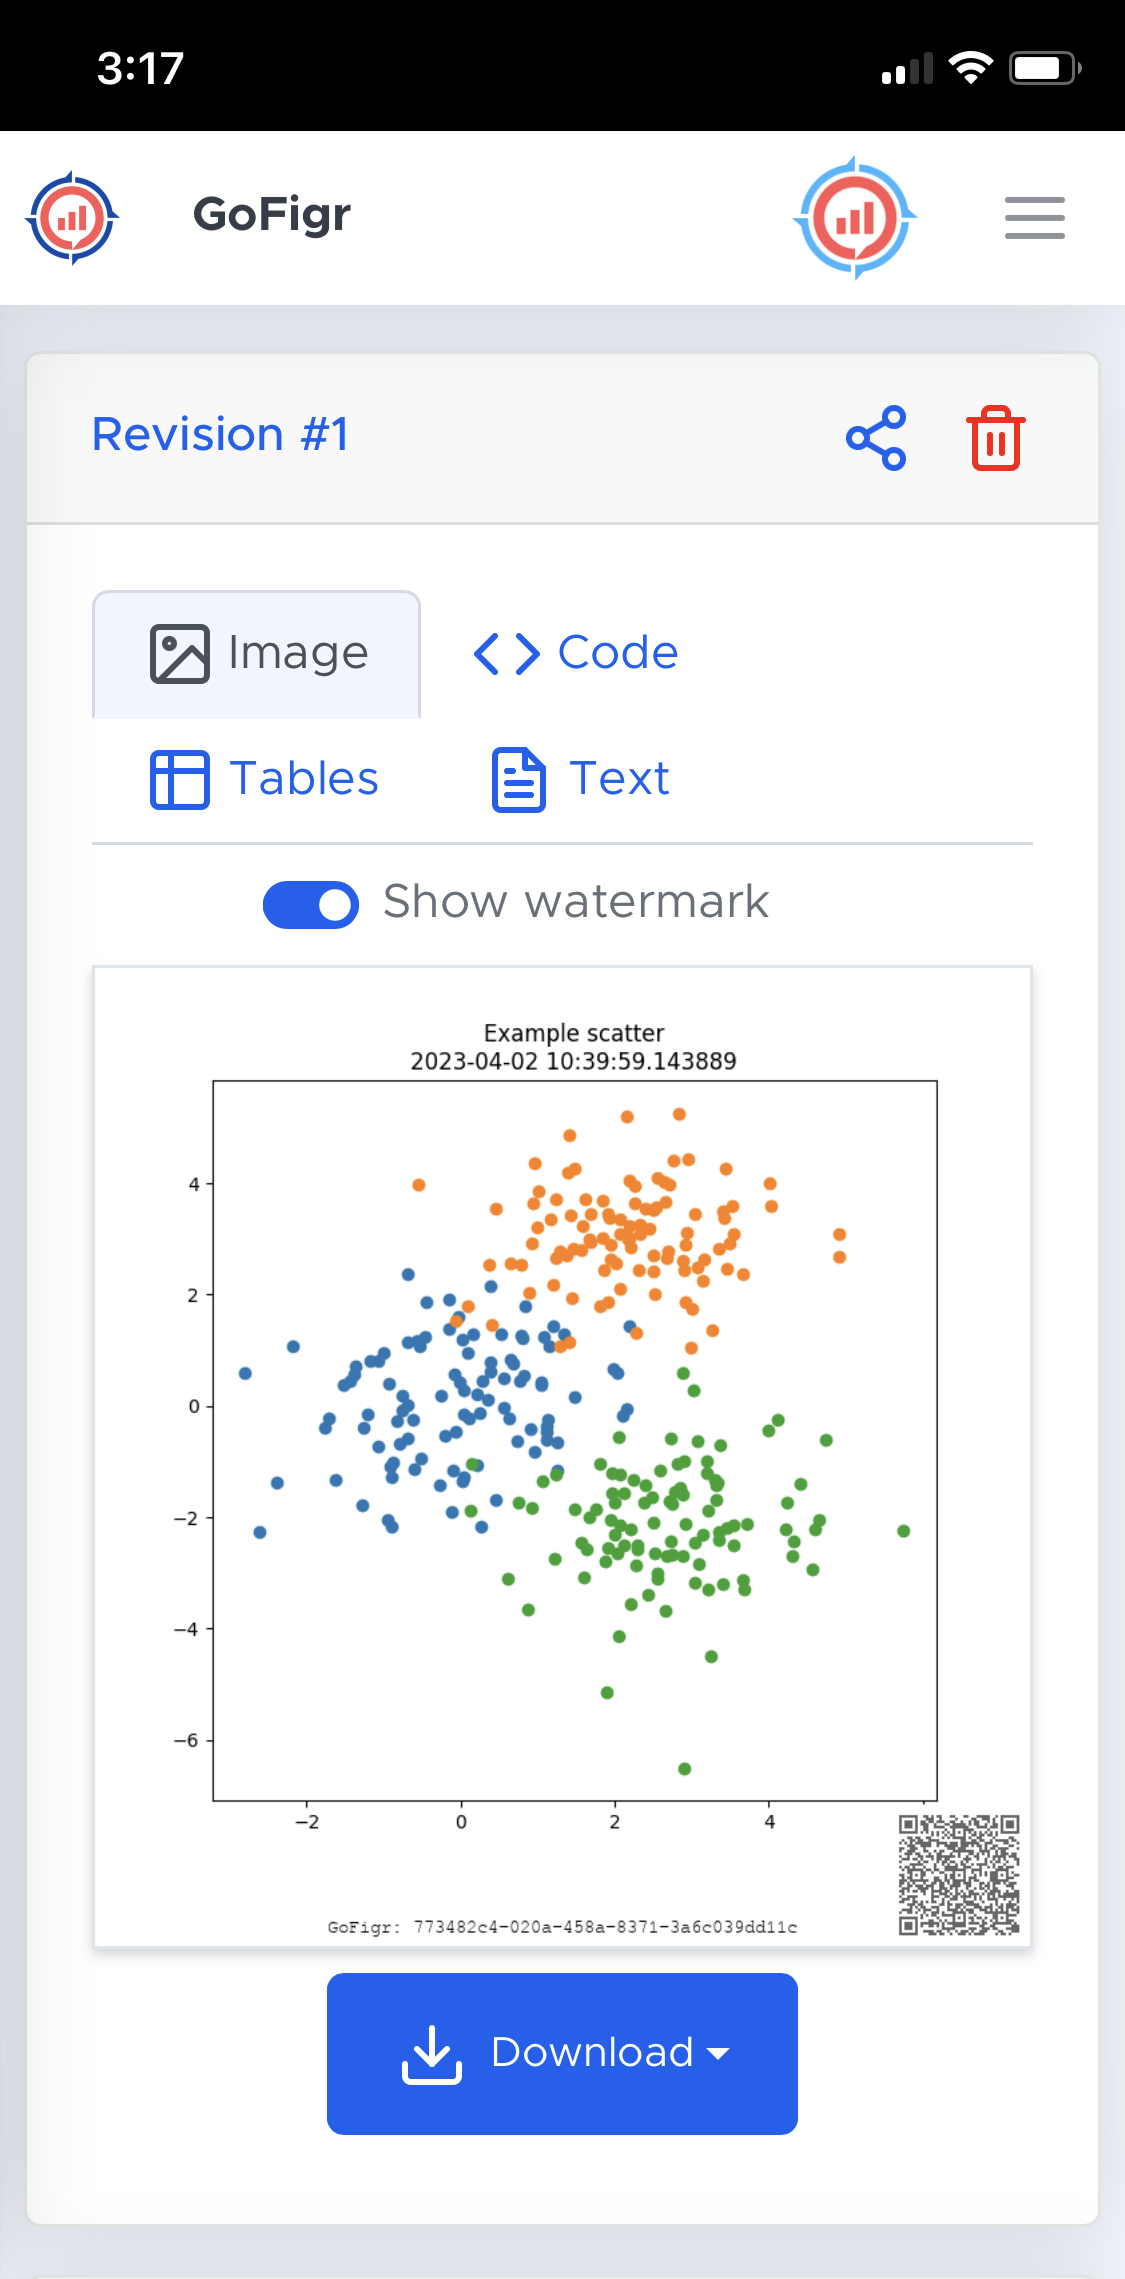
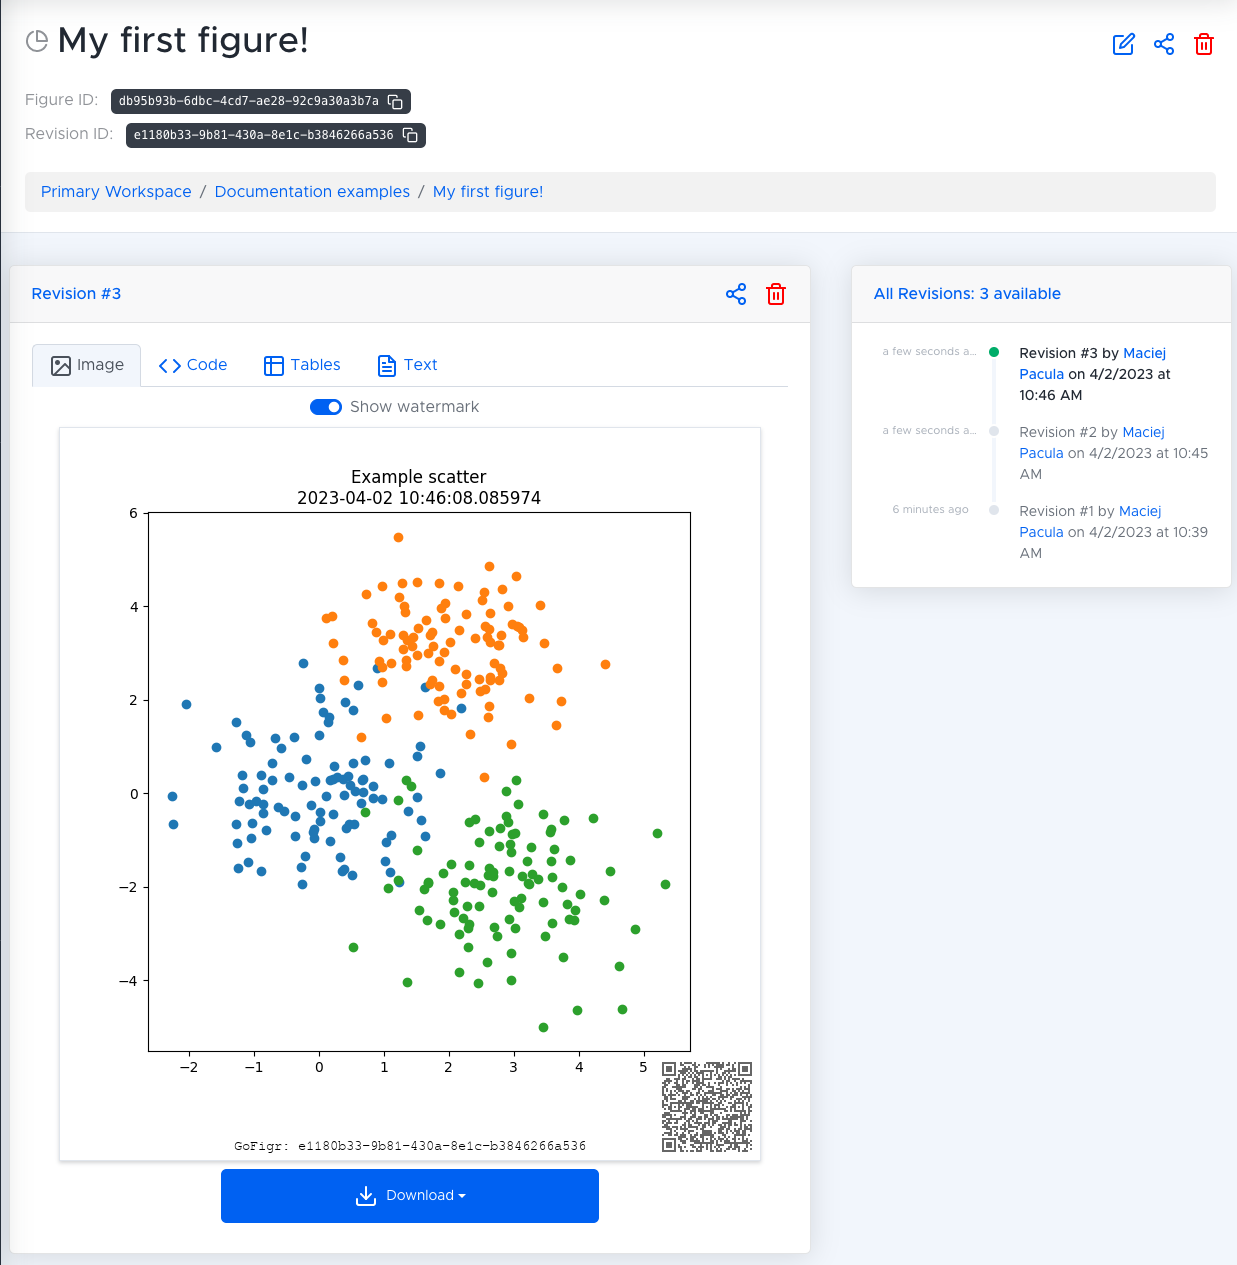
You can now scan the barcode or manually navigate to the figure in the Web App at https://app.gofigr.io .

Publishing new revisions
Feel free to run the above code multiple times. GoFigr will automatically capture the different revisions:
