
Real-Time Capture Setup
GoFigr’s Real-Time Capture automatically syncs every figure you create — along with its source code, data, and environment — to the GoFigr web app. Once enabled, there’s nothing to do manually: figures appear in GoFigr as you create them.
The quickest way to get started is the setup wizard in the GoFigr web app. It generates a ready-to-use starter file for your environment in four steps.
Launching the Wizard
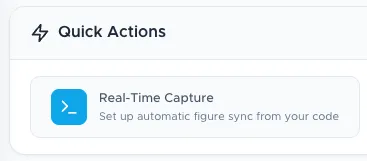
Section titled “Launching the Wizard”Click Real-Time Capture under Quick Actions on the home page:
Walkthrough
Section titled “Walkthrough”Step 1: Choose Your Environment
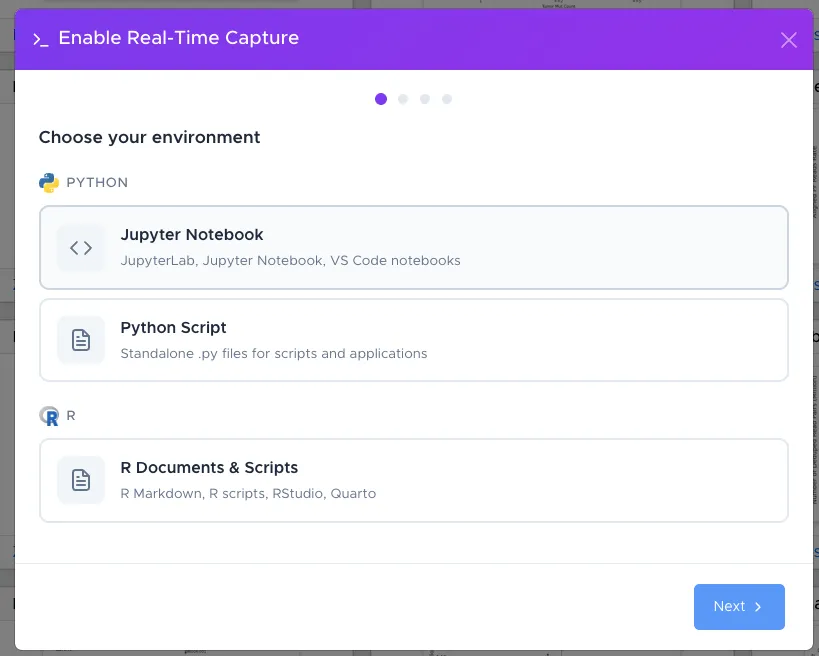
Section titled “Step 1: Choose Your Environment”Select the environment that matches your workflow:
- Jupyter Notebook — JupyterLab, Jupyter Notebook, VS Code notebooks
- Python Script — Standalone
.pyfiles for scripts and applications - R Documents & Scripts — R Markdown, R scripts, RStudio, Quarto
Step 2: Install & Configure
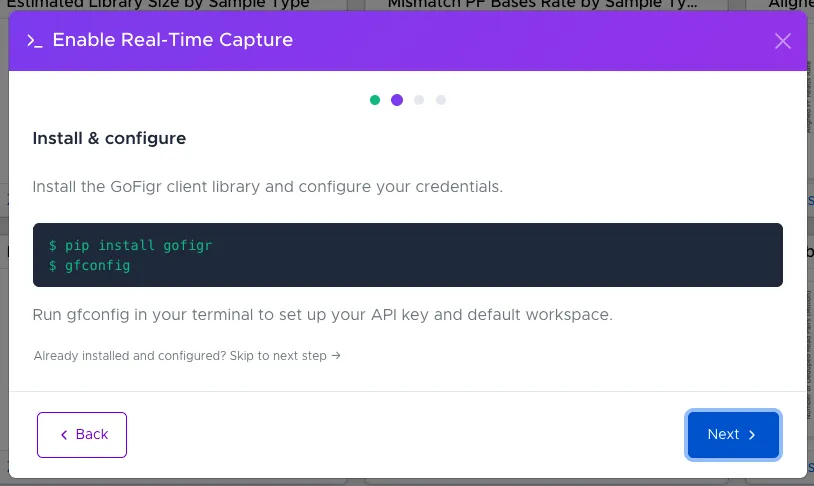
Section titled “Step 2: Install & Configure”The wizard shows the install commands for your chosen environment. For Python, this is:
$ pip install gofigr$ gfconfiggfconfig is a one-time setup that saves your API key and default workspace to ~/.gofigr. If you’ve already run it, click “Skip to next step” to continue.
Step 3: Configure Where Figures Go
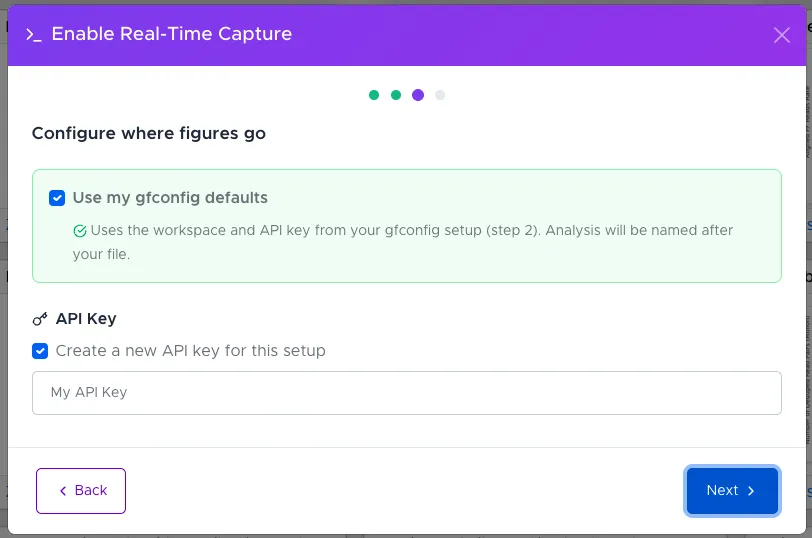
Section titled “Step 3: Configure Where Figures Go”Choose how your figures are routed:
- Use my gfconfig defaults — Uses the workspace and API key from your
gfconfigsetup (Step 2). The analysis will be named after your file. - API Key — Optionally create a new API key dedicated to this setup, or use an existing one.
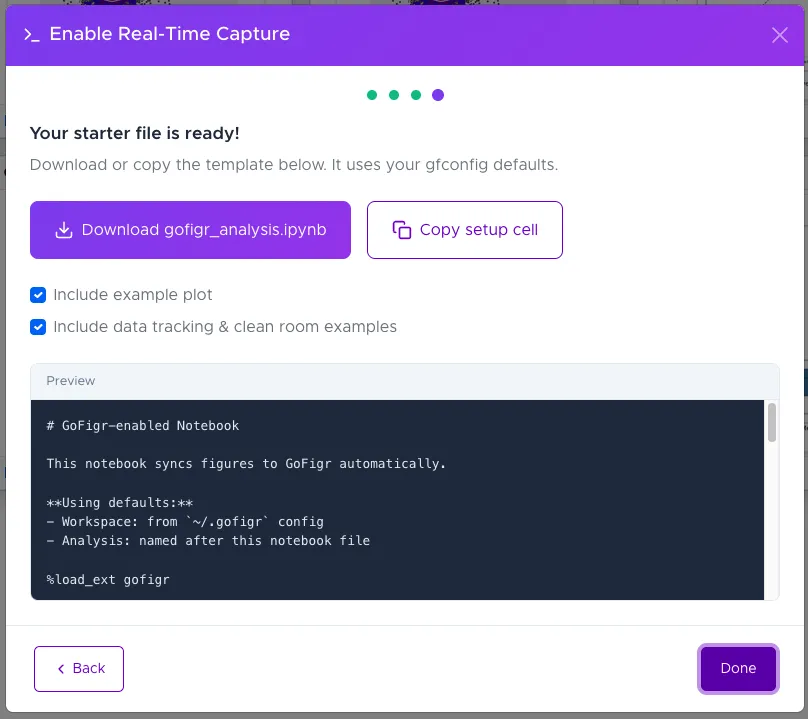
Step 4: Download Your Starter File
Section titled “Step 4: Download Your Starter File”Your starter file is ready. You can:
- Download the file directly
- Copy to clipboard and paste into your editor
The generated file includes:
- GoFigr initialization with your chosen settings
- An example plot to verify everything works
- Optional data tracking and Clean Room examples
What the Starter File Does
Section titled “What the Starter File Does”When you run the generated file, every figure you create is automatically captured and synced to GoFigr — including the source code that produced it. This means:
- Full provenance: Each figure is linked to the exact code, data, and environment that created it
- Automatic organization: Figures are grouped into analyses named after your file
- QR codes: Each figure gets a unique QR code and revision ID for easy tracking
- No manual publishing: Figures appear in GoFigr as you create them
Next Steps
Section titled “Next Steps”- Clean Room (Python) / Clean Room (R) — Make your figures fully reproducible and re-runnable in the browser
- AI Story Mode — Turn your captured figures into presentations
- Auto-Assign — Let AI organize figures into analyses automatically