Managed notebooks
Launch Jupyter, R, or code-server on our compute in seconds — nothing to install, AI assistant built in, and every figure tracked from the first cell. Simple hourly pricing with a generous allowance on every plan.
gofigr for biotech teams
Python and R, in the tools you already use. Your infrastructure or ours — install GoFigr as a plugin in your existing environment, or launch a fully managed notebook in seconds.
Our managed notebooks run Jupyter, R, and code-server, with simple hourly pricing. The plugin drops into JupyterLab, RStudio, VS Code, Databricks, and more.
trusted by top organizations






your infrastructure or ours
Launch Jupyter, R, or code-server on our compute in seconds — nothing to install, AI assistant built in, and every figure tracked from the first cell. Simple hourly pricing with a generous allowance on every plan.
Install the gofigr package where you already work — JupyterLab, RStudio, VS Code, Databricks, or your cluster. Figures publish to GoFigr with their code and data; your compute and files stay on your infrastructure.
why biotech teams choose gofigr
01 · figure capture
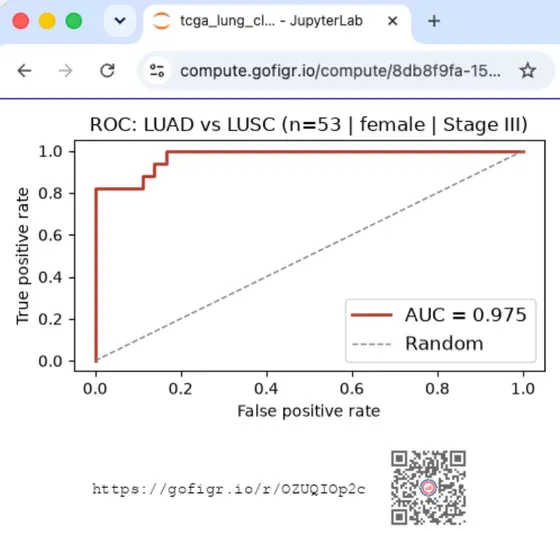
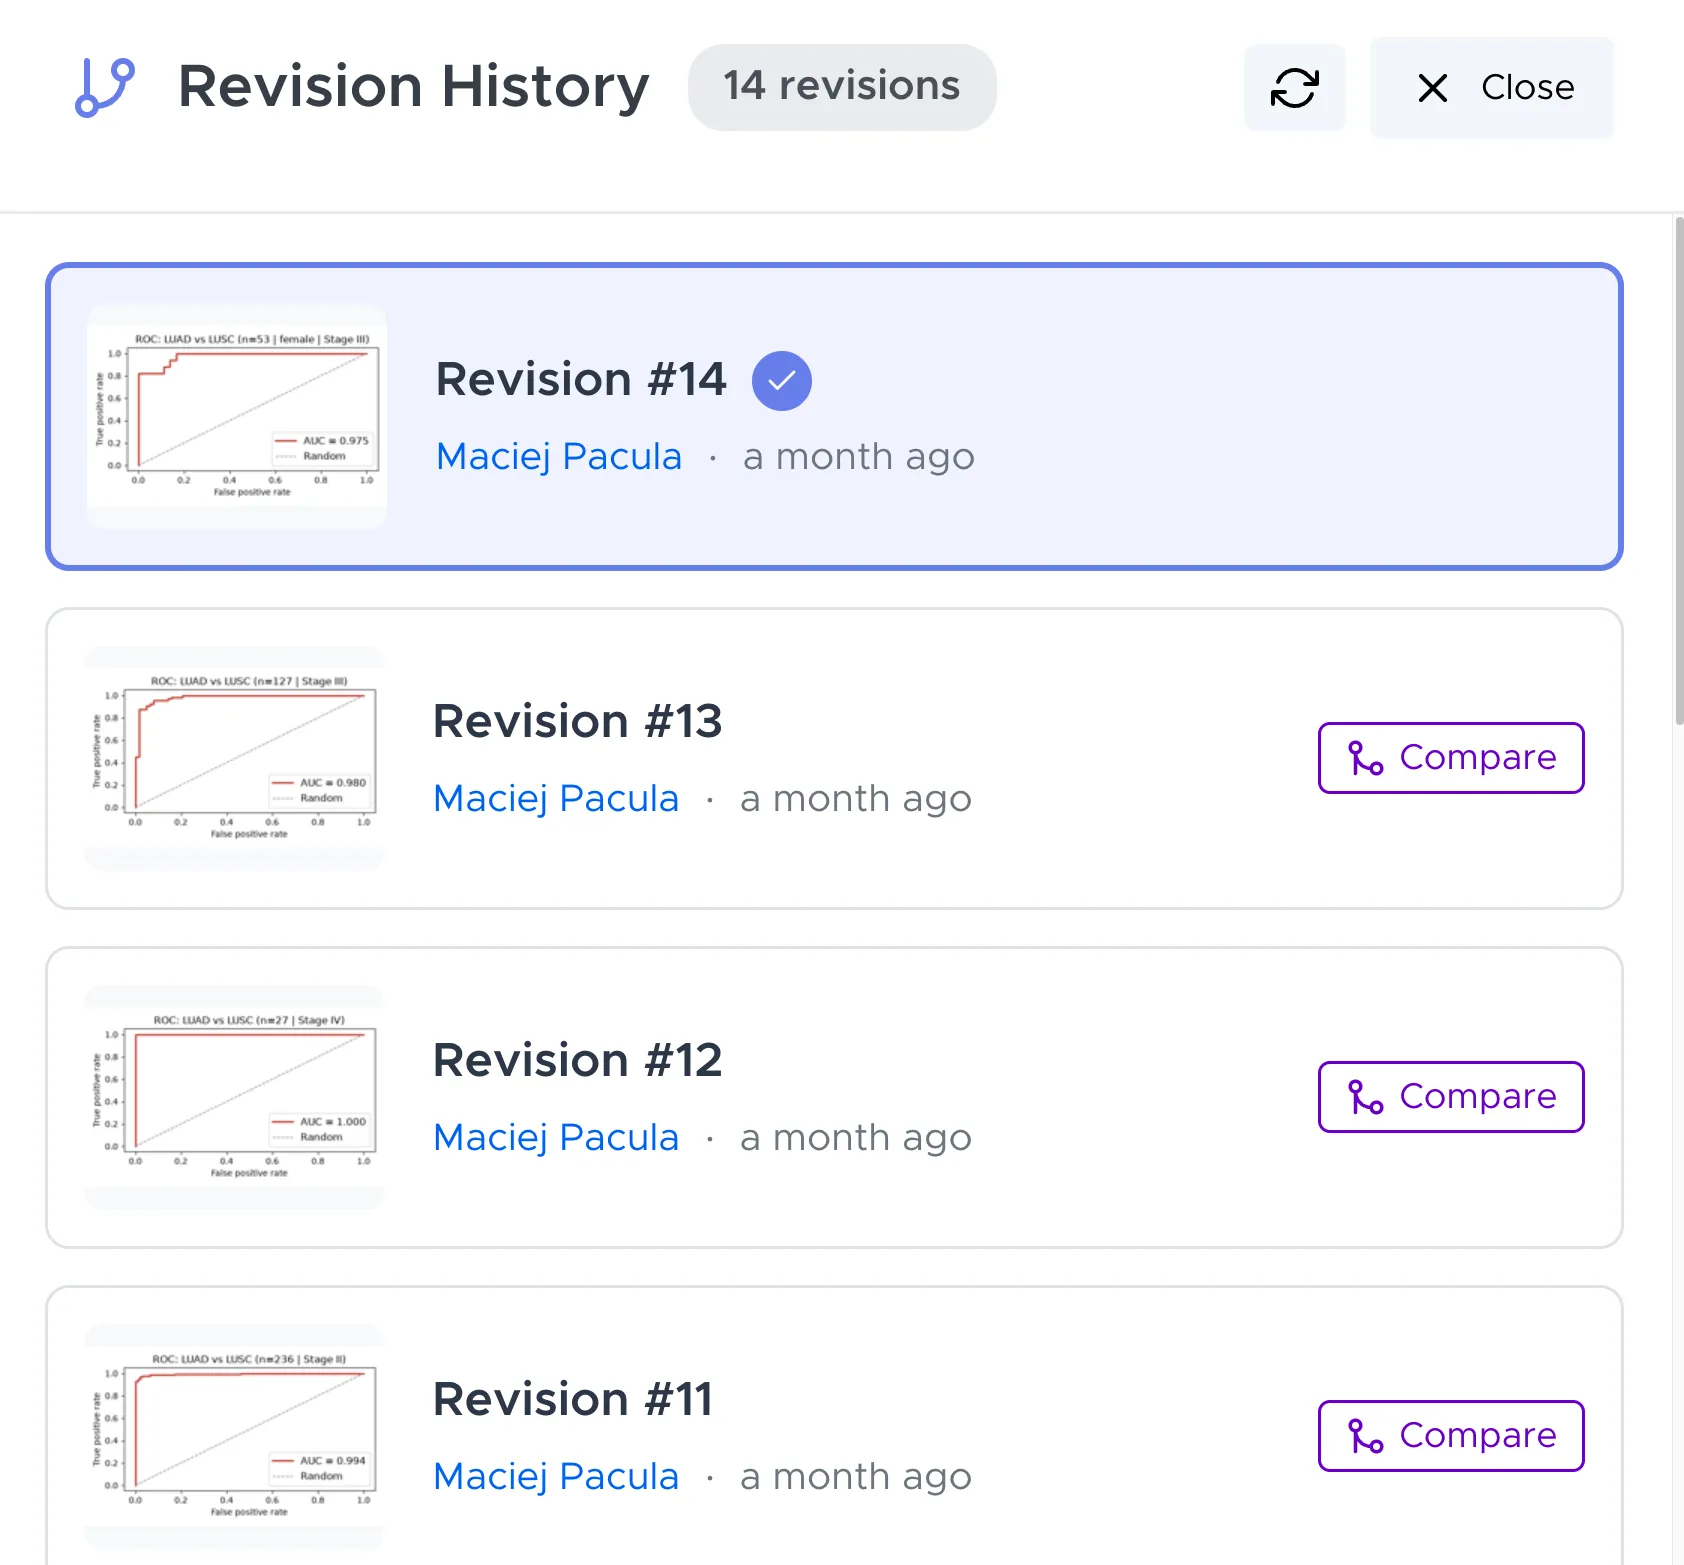
We capture and version every figure you generate in Jupyter and R.
Our QR codes ensure your figures link to their code and data even when used in PowerPoint, Slack, or email.
02 · gofigr ai
You can answer detailed questions because you have the full context behind every figure: the source code, the parameters, and the data. Or let GoFigr AI do that for you.
No more wondering: did we use replicates? What assay version did we use? Did we apply multiple testing correction?
03 · data lineage
Sample sheet received over email? No problem.
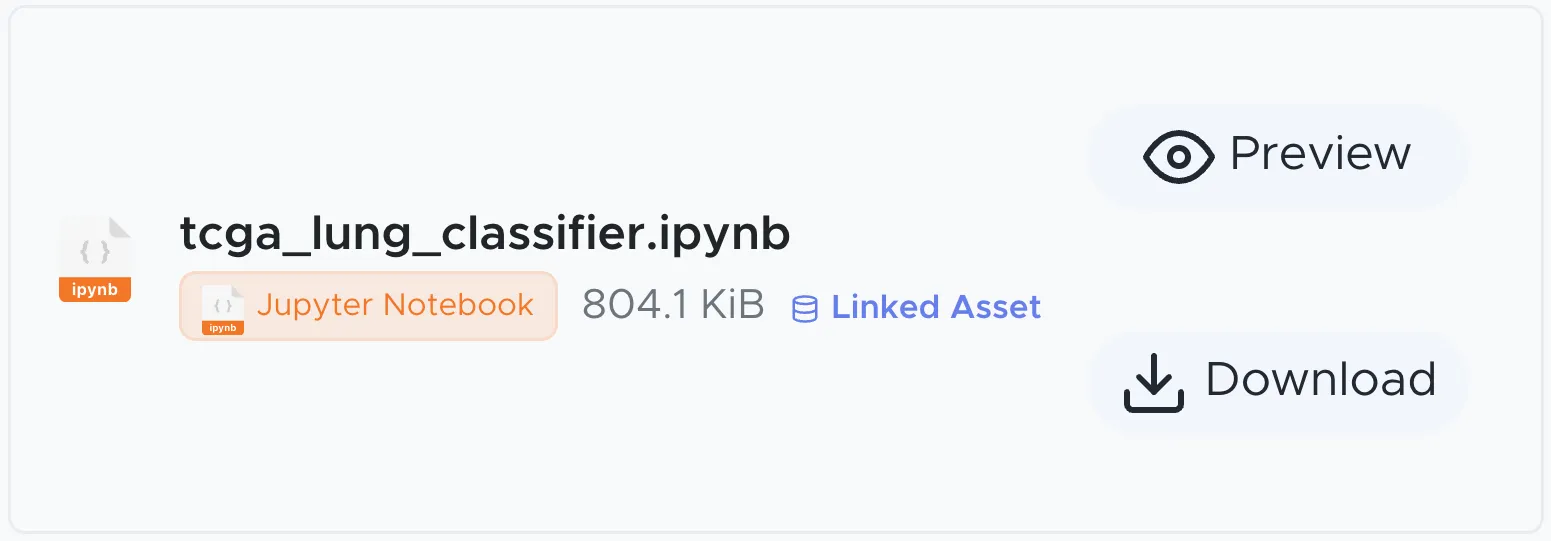
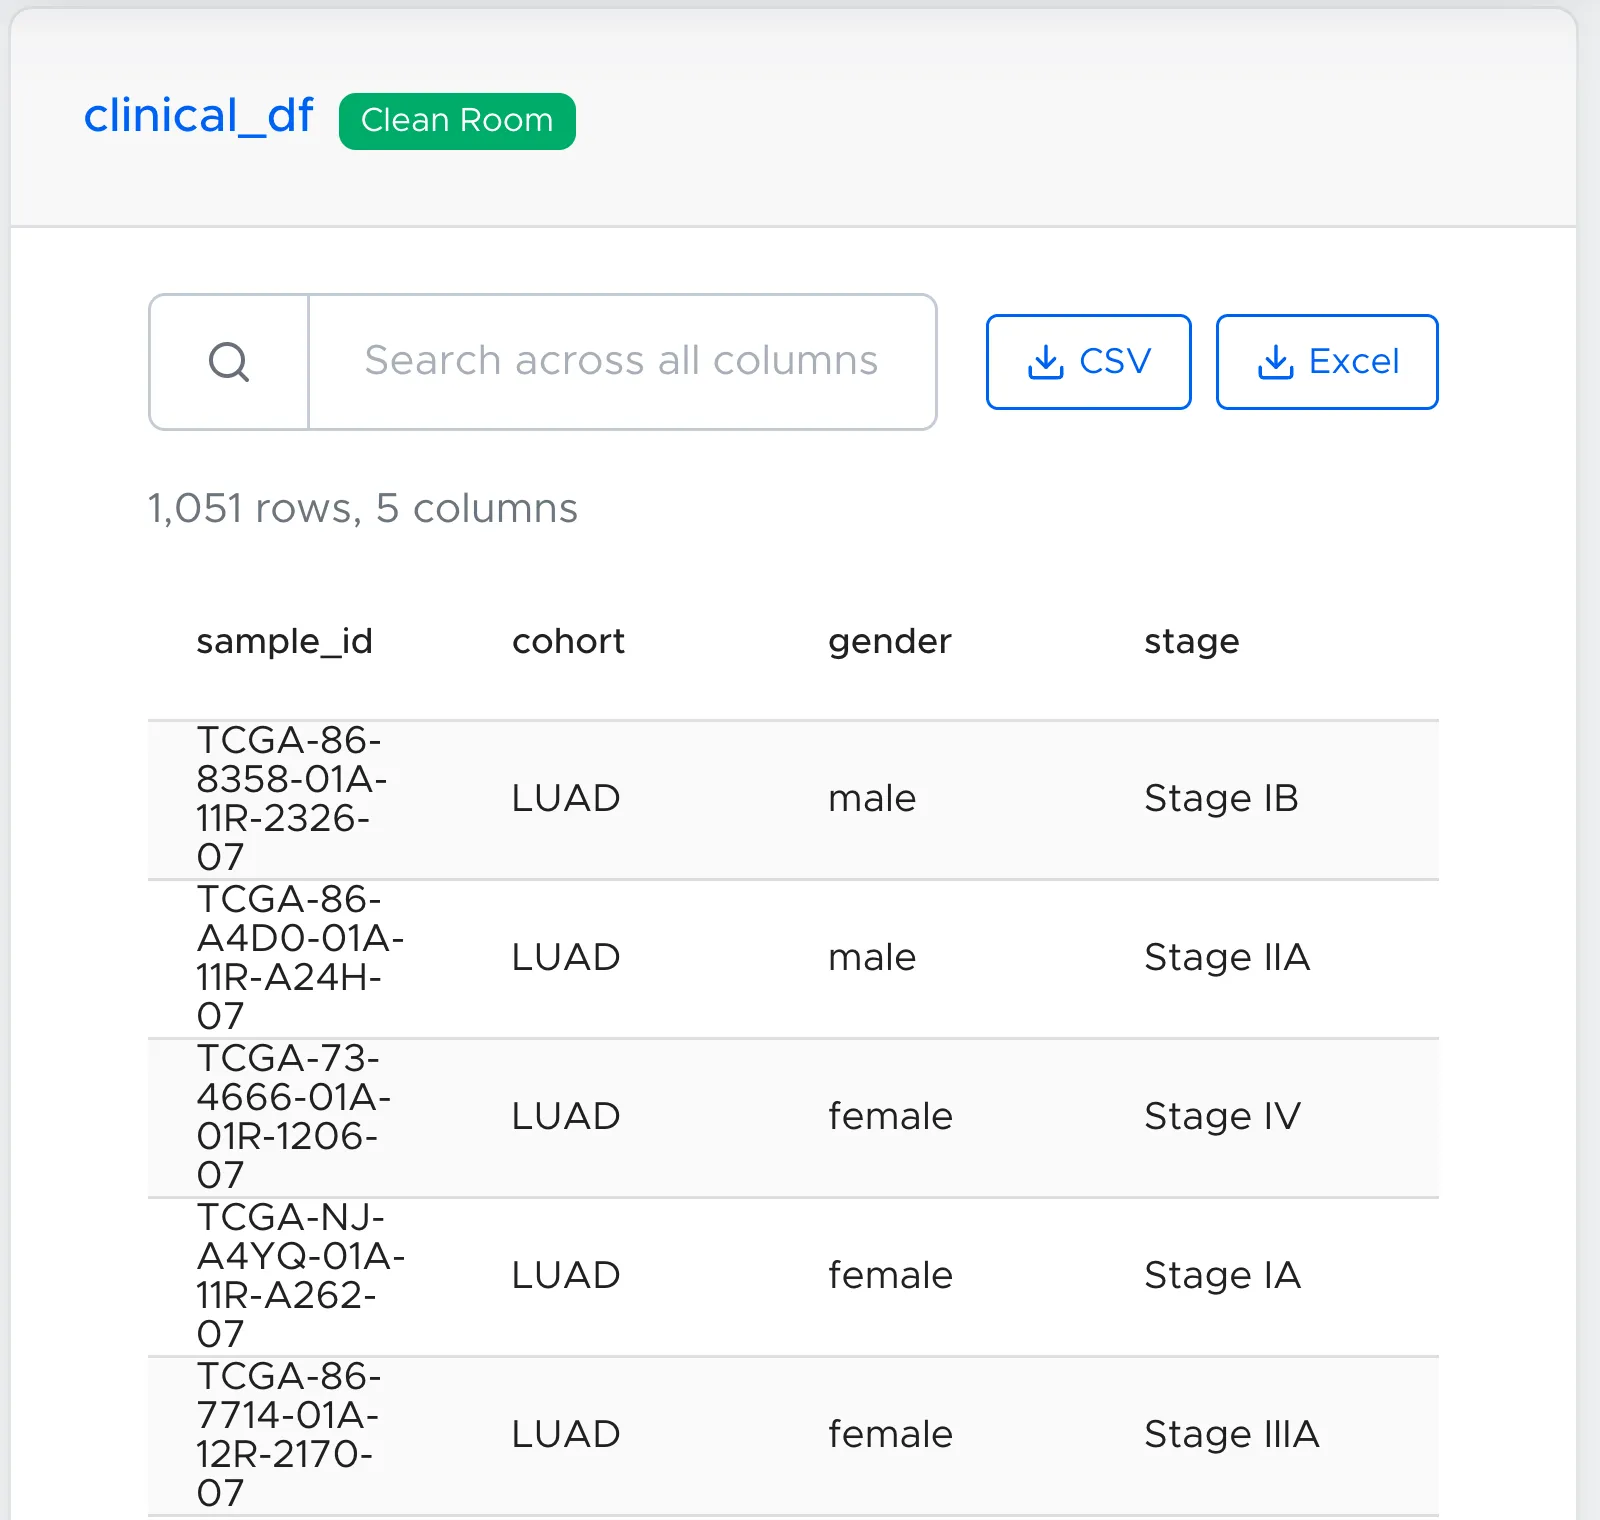
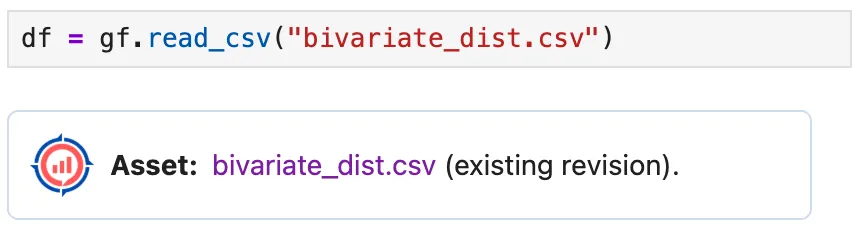
We offer drop-in replacements for data readers in pandas and R. That sample sheet is now tracked, versioned, and linked to all figures which use it.
04 · audit trail
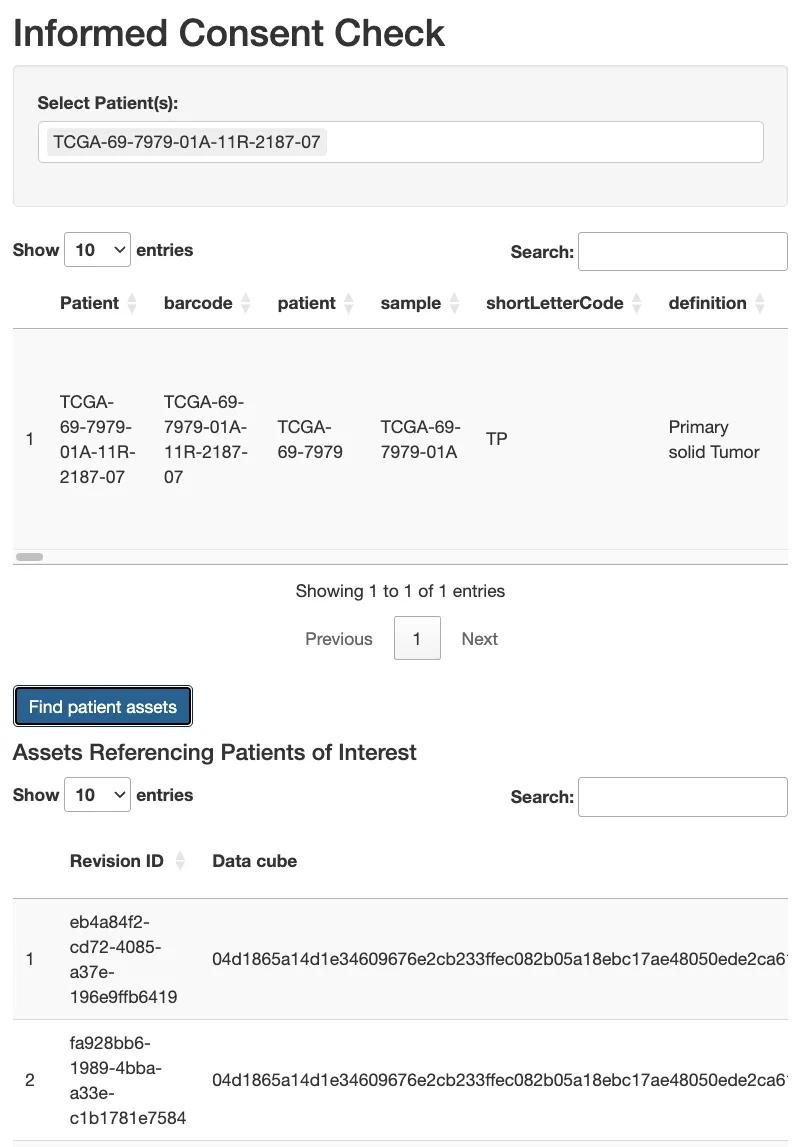
Track informed consent down to the exact figure. GoFigr can streamline compliance for clinical trials by embedding patient IDs directly in the figures, so you can find the exact figures referencing a given patient.
Maintain full compliance while letting your data team analyze ongoing clinical trial data with minimal overhead or red tape.
05 · text + visual search
Every figure in our platform is instantly searchable — by title, axis label, or any other text in your figure.
GoFigr includes both text and visual search: find the source notebook even if the figure is missing our QR code.
06 · clean room
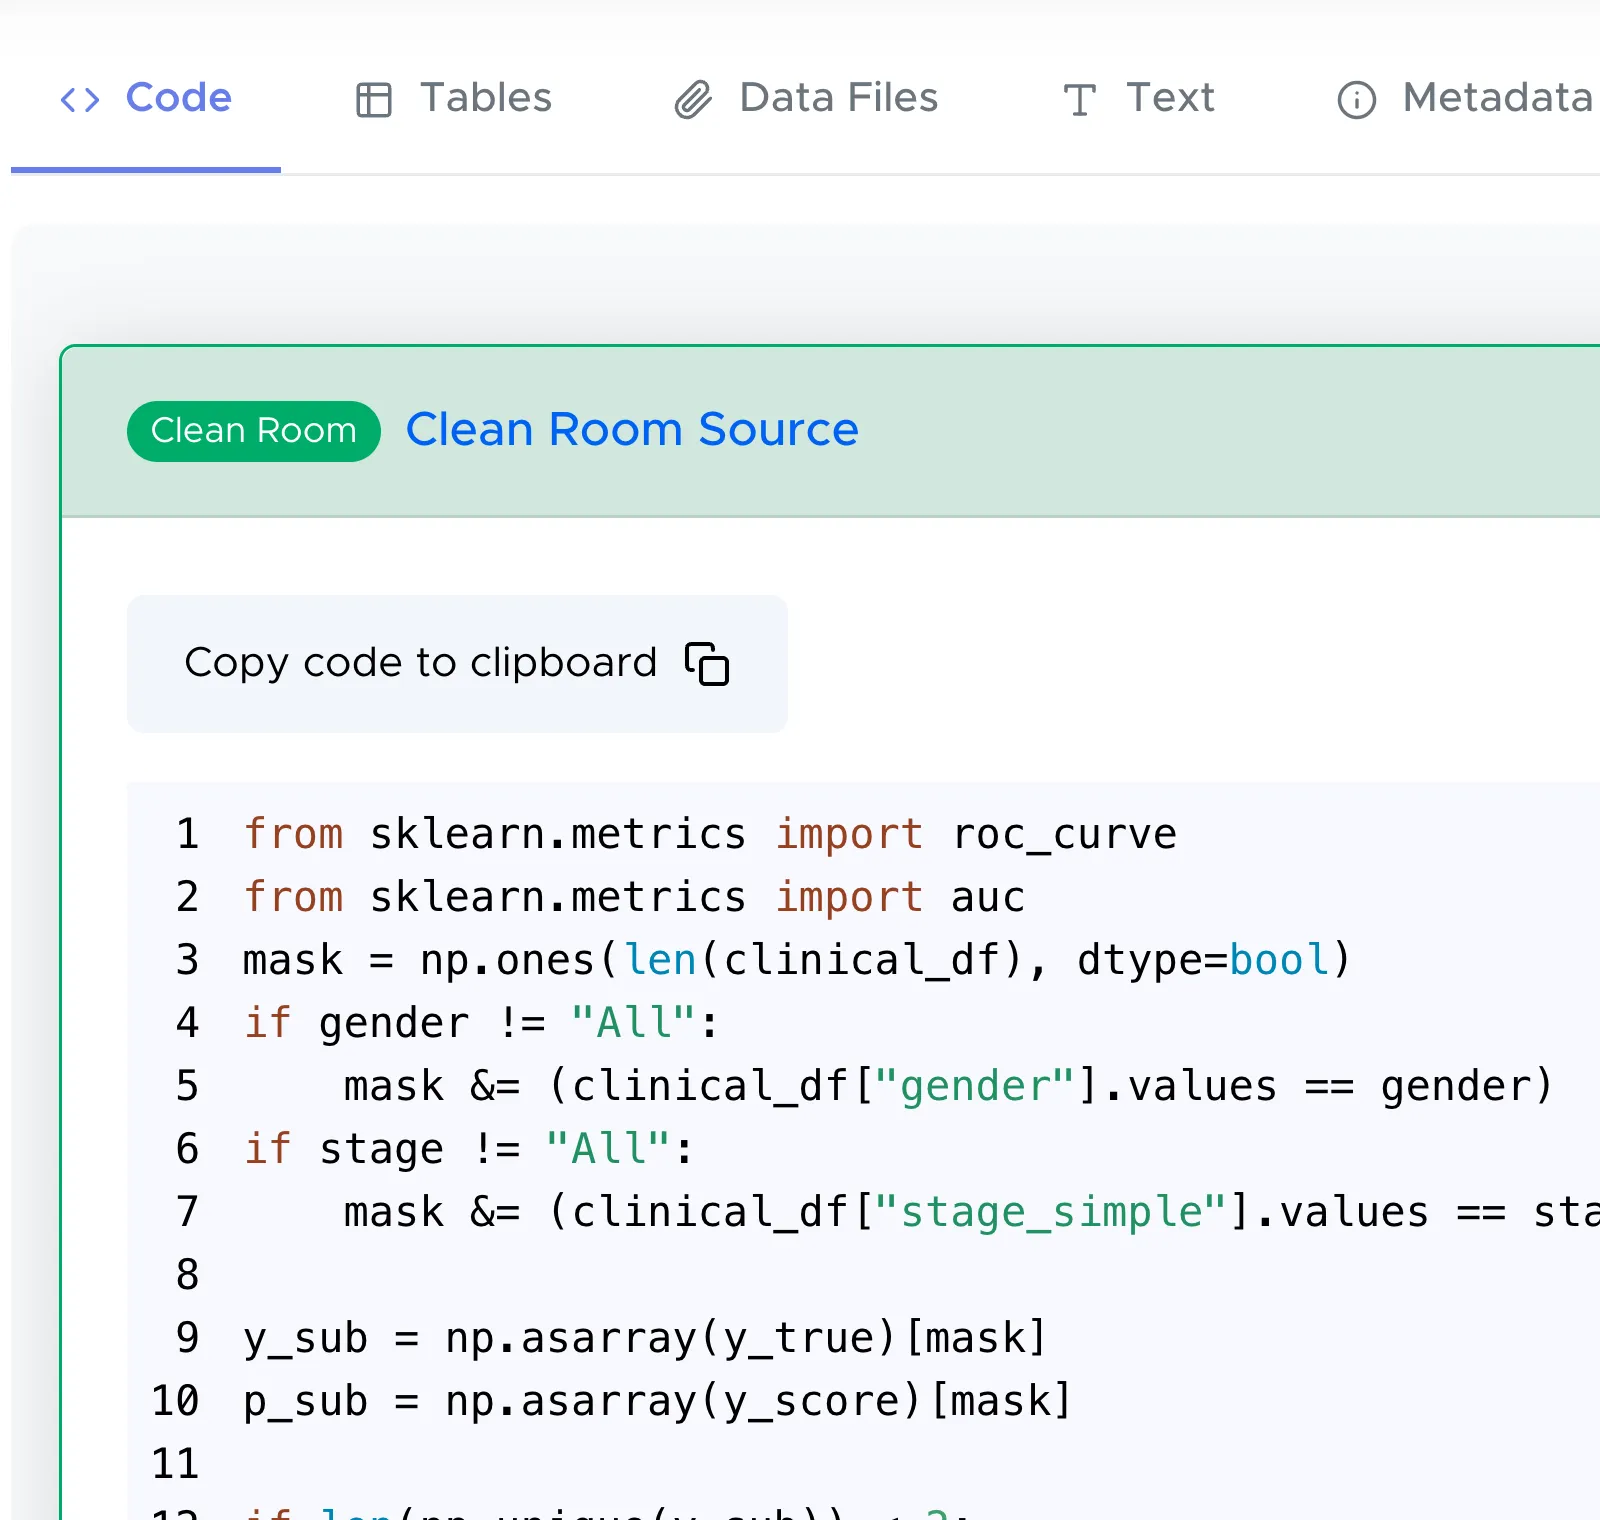
GoFigr can package every ggplot2 or matplotlib figure into a self-contained, reproducible web application.
Re-run plots and change analysis parameters months later. Let stakeholders make their own adjustments with AI-assisted editing.
No more hunting old notebooks just to change colors or re-label axes.
bring your team
Simple plans with a generous compute allowance — view pricing. We work with clinical trial teams and regulated labs to fit GoFigr into existing SOPs: info@gofigr.io.