Getting started with GoFigr in R
Getting started with GoFigr in R is easy! We support both interactive sessions in RStudio as well as integration with knitr.
Step 1: Register for a GoFigr account
Register for an account here: https://app.gofigr.io/register
Step 2: Install the client library
library(devtools)devtools::install_github("https://github.com/gofigr/gofigR")Step 3: Load the library and configure with gfconfig
The wizard will prompt you for a username and password, and will automatically generate an API key for you.
> library(gofigR)Attaching package: ‘gofigR’
> gfconfig()-------------------------------------------------------------------Welcome to GoFigr! This wizard will help you get up and running.-------------------------------------------------------------------
Username: demoPassword: *******************Testing connection...  => SuccessAPI key (leave blank to generate a new one):Key name (e.g. Alyssa's laptop): work laptopFetching workspaces...

| Number|Name              |Description                  |API.ID                               ||------:|:-----------------|:----------------------------|:------------------------------------||      1|Primary Workspace |demouser's primary workspace |98f328fc-f984-482c-b7f6-8ed272527a42 ||      2|Rocketship Bio    |Let's do some science        |bff6c952-fb2c-4333-80e5-5dc7291d47cc ||      3|Plotly demos      |N/A                          |1424ea0f-7d42-4ef5-9ba8-41aa9c5b1a94 |
Please select a default workspace (1-3): 1
Configuration saved to /Users/maciej/.gofigr. Happy analysis!
Step 4: Open your Rmd file and call gofigR::enable in the setup chunk
```{r setup, include=FALSE}library(gofigR)
gofigR::enable(auto_publish=TRUE)```
That’s it! From now on, all ggplots will be published automatically:
```{r correlations}p <- ggplot(mtcars, aes(x=wt, y=mpg, color=cyl, size=cyl)) + geom_point() + theme(legend.position="none")plot(p)```If you do not wish to enable automatic publishing, you can still publish plots manually with publish:
p <- ggplot(mtcars, aes(x=wt, y=mpg, color=cyl, size=cyl)) + geom_point() + theme(legend.position="none")publish(p, "My manually published figure")Both knitr and interactive use within RStudio are supported:
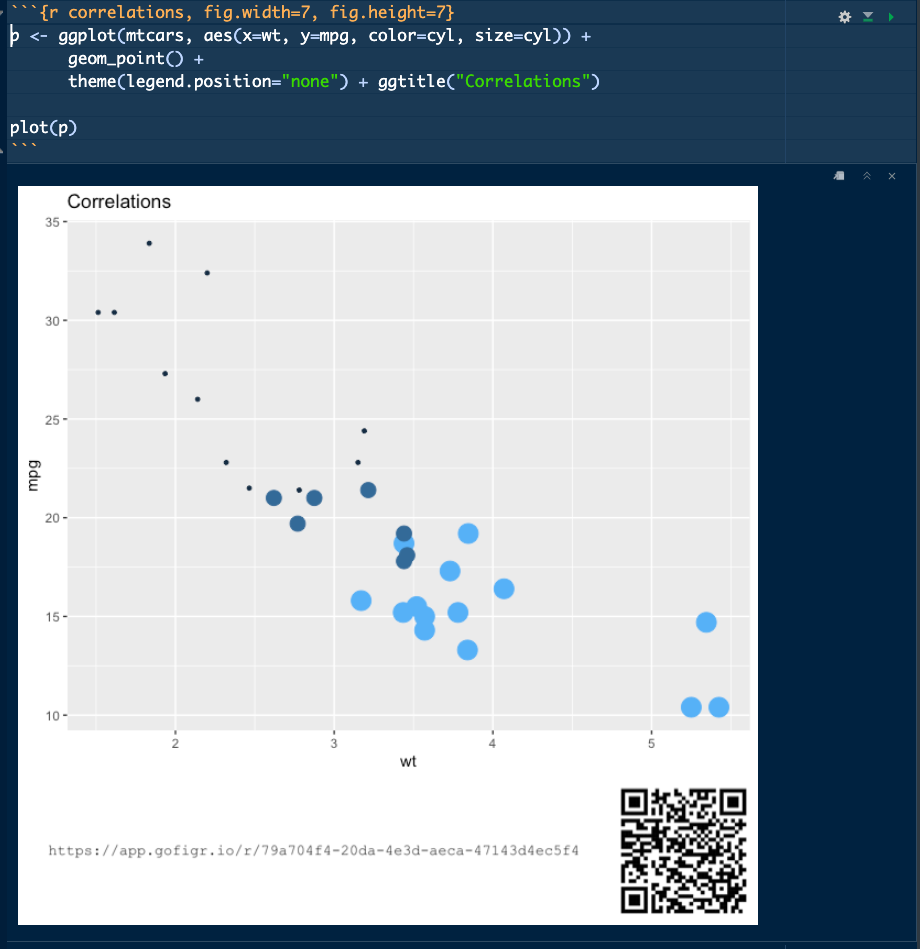
If you want to publish output from base R plotting functions, you can capture those manually with gofigR::publish_base. Use the name argument to supply the figure name. For example:
```{r manual_capture, fig.width=8, fig.height=8}library(RColorBrewer)
gofigR::publish_base({  base::plot(pressure, main="Pressure vs temperature")  text(200, 50, "Note the non-linear relationship")}, data=pressure, figure_name="Pressure vs temperature")
gofigR::publish_base({  # The mtcars dataset:  data <- as.matrix(mtcars)
  coul <- colorRampPalette(brewer.pal(8, "PiYG"))(25)  heatmap(data, scale="column", col = coul, main="Visualizing mtcars")}, data=mtcars, figure_name="Cars")```
The data argument, if provided, specifies which data to associate with the figure (it will be stored as an RDS file). Here’s what that looks like inside RStudio:
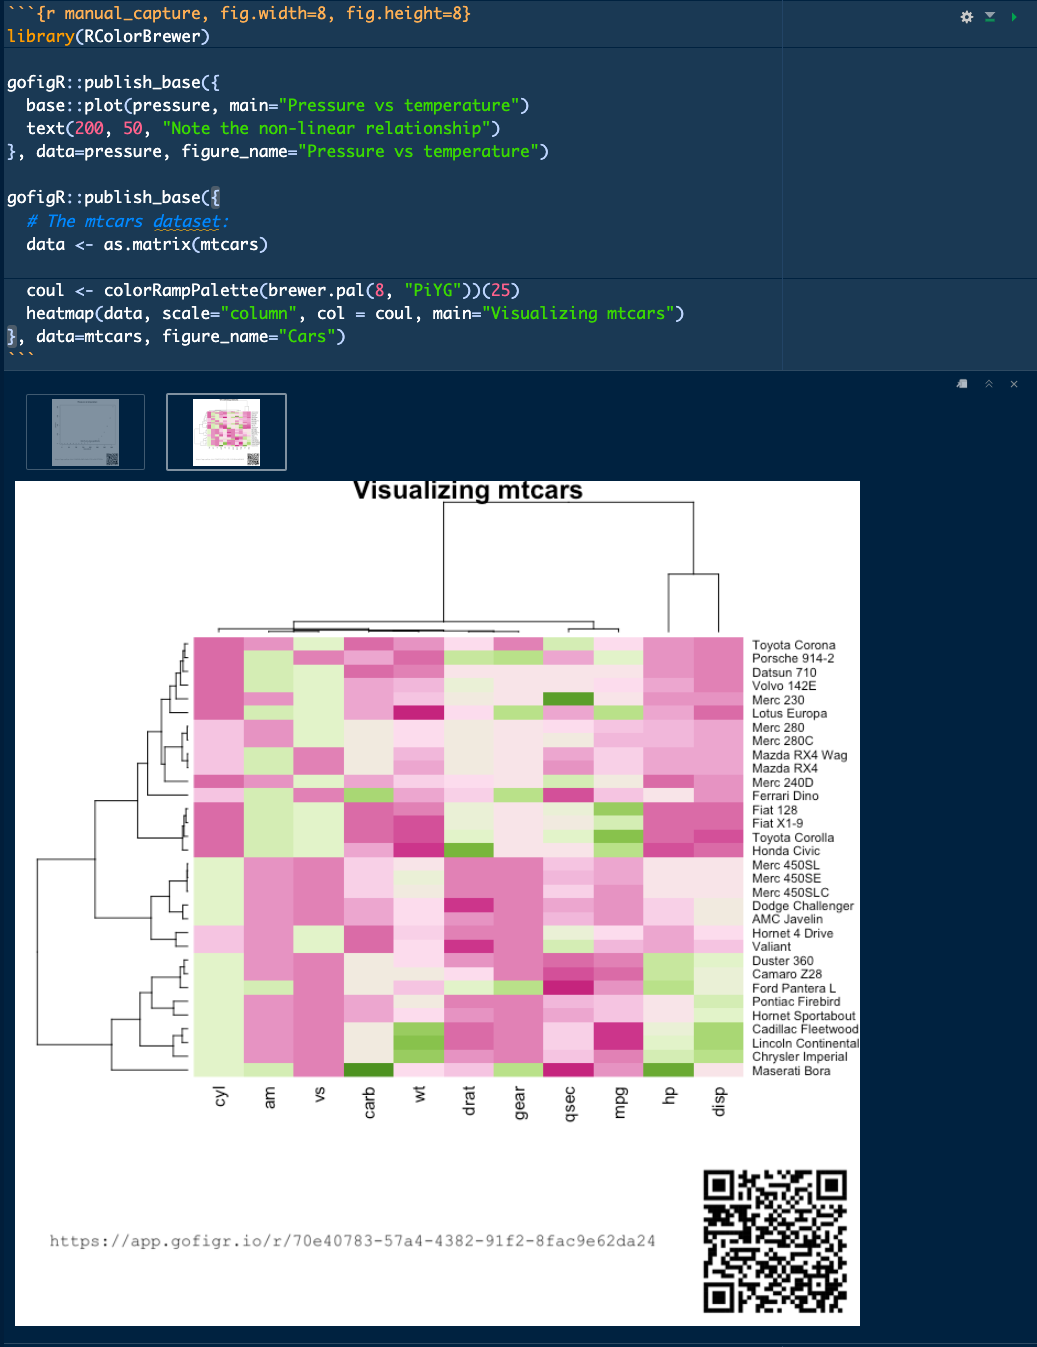
Example knitr output
You can view the knitted output for the examples above here.
Next steps & getting help
For more documentation, please check out the README included with the library, also available here: https://github.com/GoFigr/gofigR/.
You can also reach out to support@gofigr.io with any questions!